FaultBench-Industrial
Documentation for a controlled benchmark of self-healing mechanisms in multi-agent industrial control.
Overview
This site is the detailed experimental record for a research project comparing four recovery-mechanism paradigms under a standardized industrial fault-injection suite. The project is framed as a controlled, apples-to-apples comparison on the same multi-agent system, with the same fault classes and the same evaluation metrics.
Research question
Under a standardized industrial fault-injection suite covering sensor noise, actuator degradation, agent dropout, communication loss, and Byzantine/adversarial agents, how do reactive rule-based reconfiguration, fault-tolerant-trained MARL, hierarchical supervisor-agent intervention, and LLM-agent-based replanning compare in performance-degradation area, safety-violation excess, time spent healthy, relapses, and detection quality (false-recovery rate and recall)?
Fault-injection suite
| Fault | Injection semantics |
|---|---|
| Sensor noise | Corrupts local observation vectors with additive Gaussian noise. |
| Actuator degradation | Corrupts the execution of action commands: a stuck actuator, a restricted range of options, or intermittent slipping. |
| Agent dropout | Removes an agent entirely and applies a fixed failsafe action in its place, simulating a node hardware crash or power loss. |
| Communication loss | Cuts the press agent's view of the sorting stage, freezing it at a stale value or blanking it out. |
| Byzantine / adversarial agents | Swaps cooperative policy for an adversarial policy taking counter-productive or malicious actions. |
Recovery mechanisms
| Mechanism | Paradigm |
|---|---|
| Rule-based reconfiguration | Fixed or detected heuristics for restoring operation. |
| Fault-tolerant-trained MARL | Policies trained or fine-tuned with faults injected during training. |
| Hierarchical supervisor-agent | An additional agent monitors others and intervenes when recovery is required. |
| LLM-agent replanning | An LLM reads structured system state and produces a recovery plan through environment control tools. |
Evaluation metrics
The scorecard records degradation-area, safety-violation excess, fraction of time healthy, relapse count, false-recovery rate, and intervention recall. Every combination is run over 8 random seeds and reported with 95% confidence intervals.
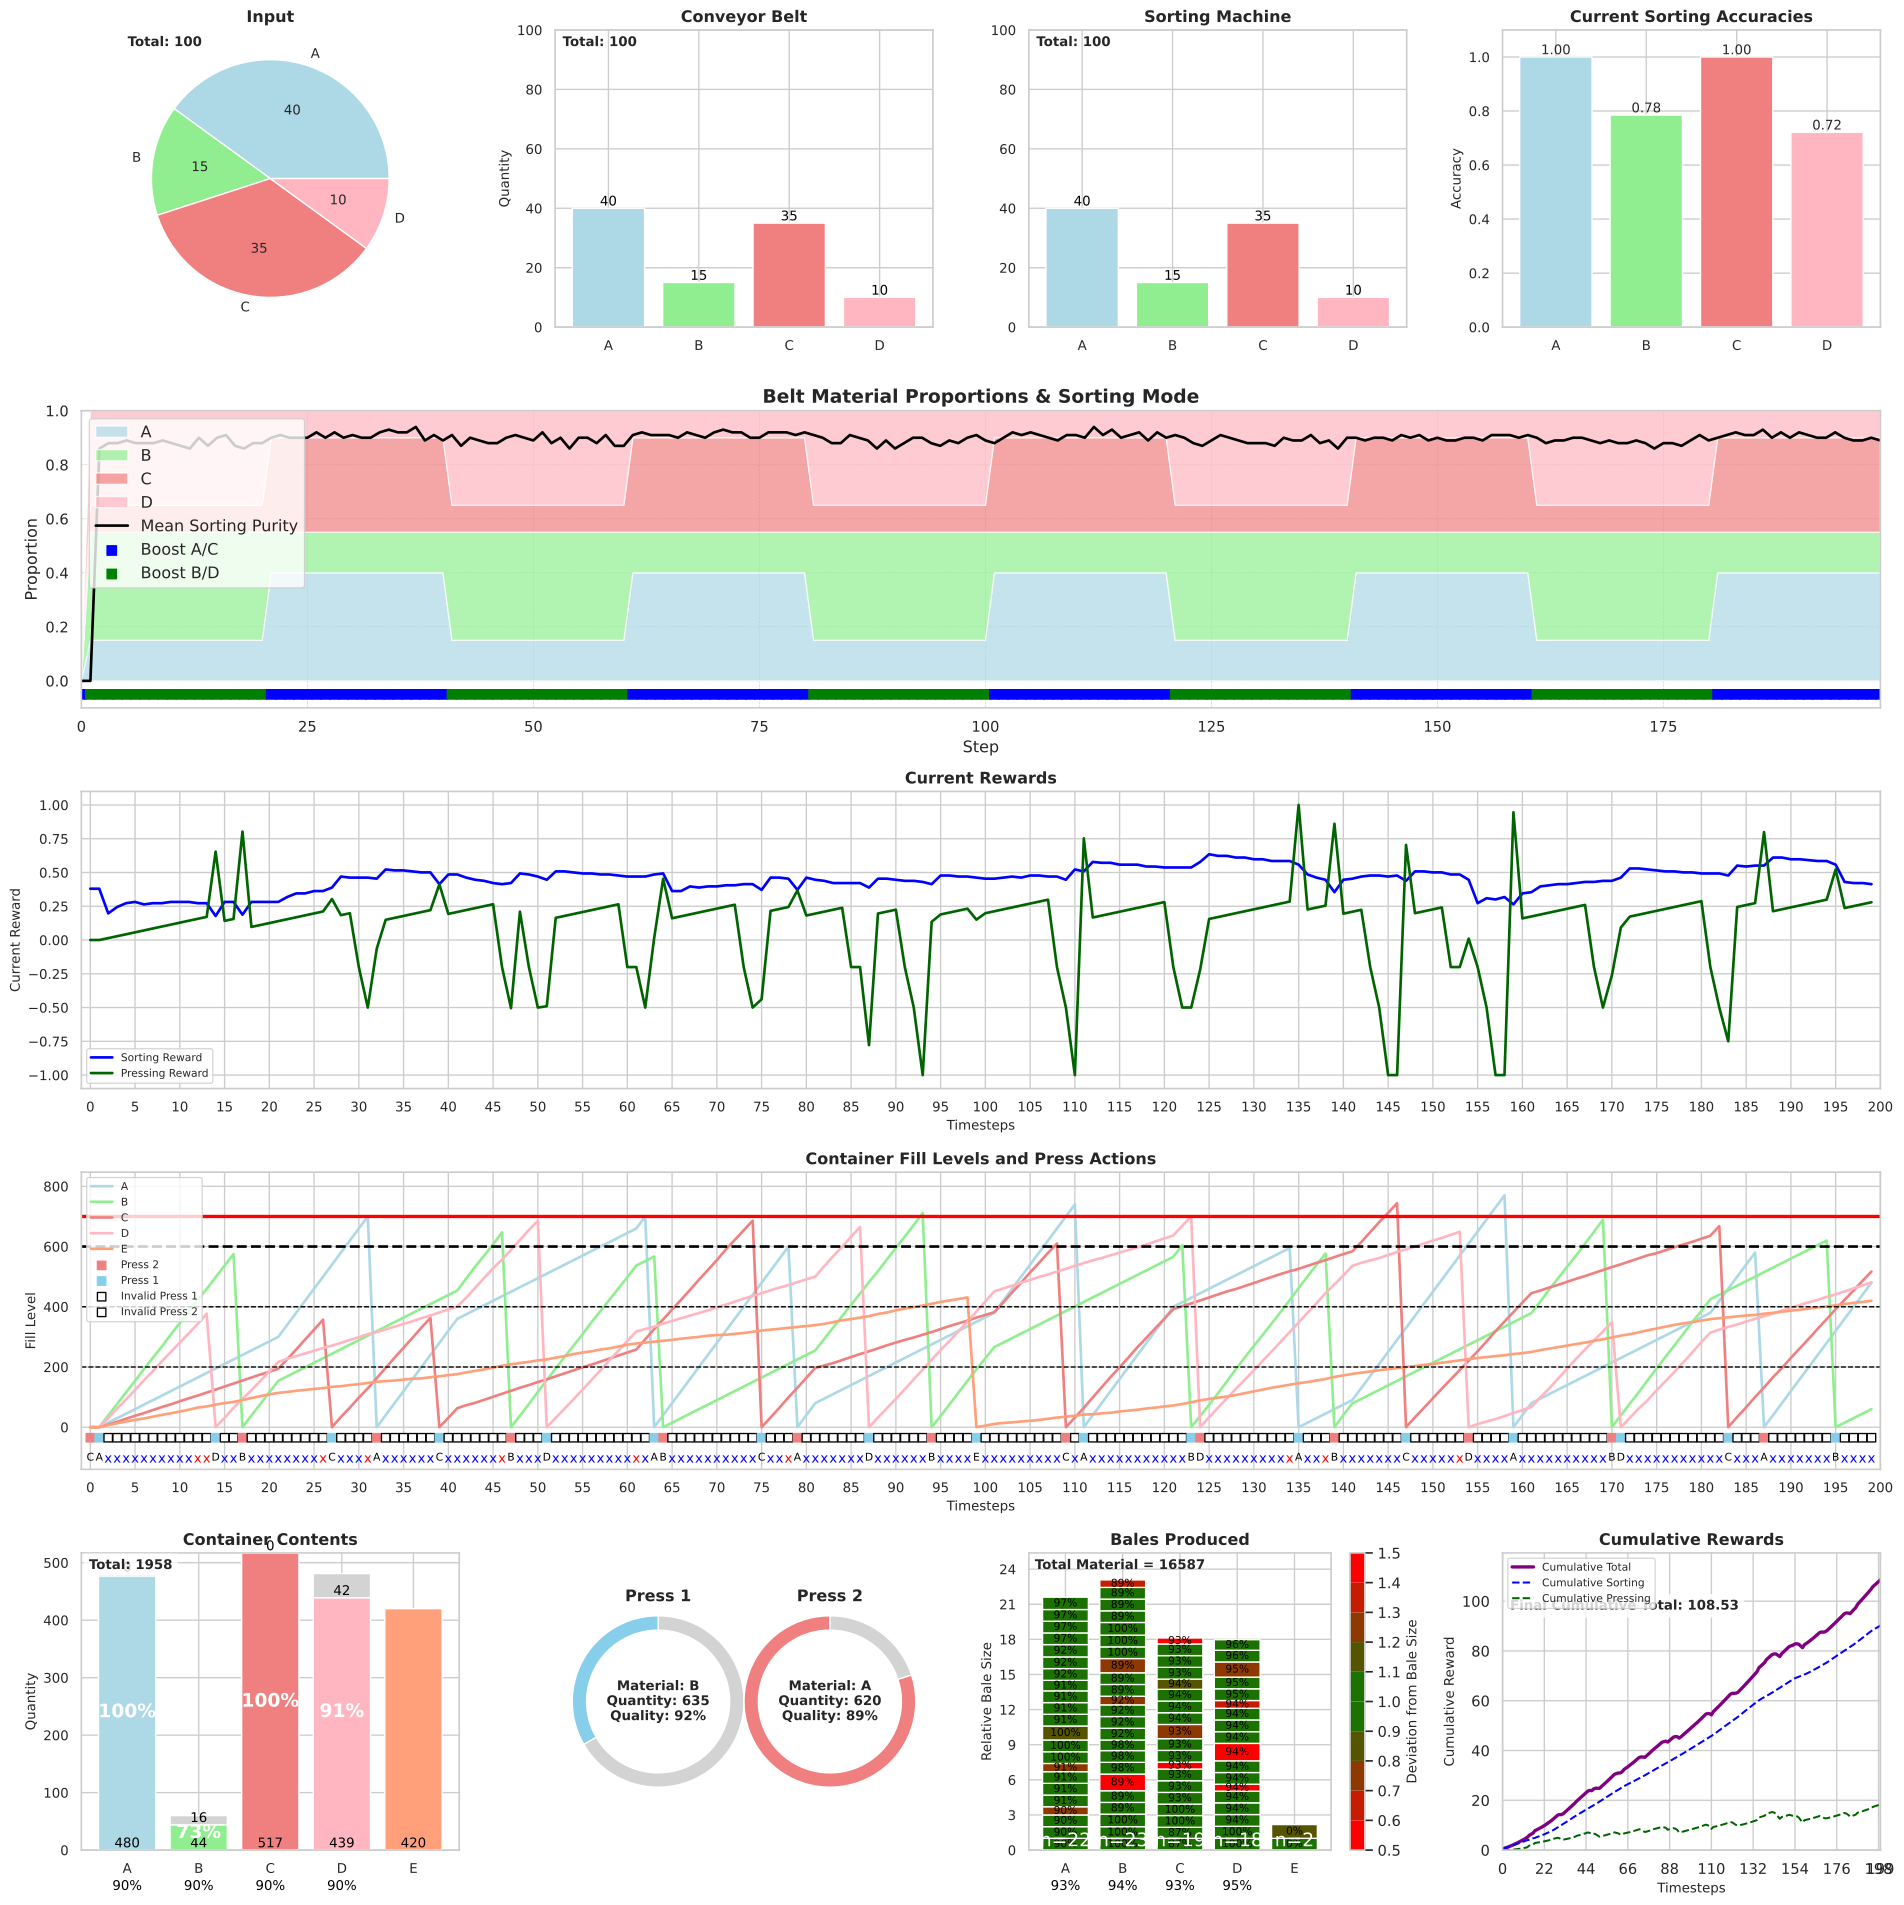
Normal state baseline
System trajectory under standard operation without any injected faults or active recovery mechanisms.
Results archive
The results area is structured around one page per fault, fault duration mode, and recovery mechanism. This allows graphs that do not fit into the paper to remain available as a complete experimental record.
The pages show one representative run per condition; the graphs for all 4,168 runs, together with the raw metrics log, are archived on Zenodo at doi:10.5281/zenodo.23304785. The files are embargoed until 10 November 2026; the record's description and DOI are public now.